HOTSPLOTS Passenger volume & passenger flows
WiFi based Passenger Flow and Passenger Volume analytics

Extension of the evaluation options for mobile hotspots
HOTSPLOTS utilises WiFi usage data from existing hotspots to gain further information and thus expand the range of functions and evaluation options. These information can be used to determine and visualise passenger flows and passenger volumes.
Based on HOTSPLOTS Telemetry, the project-specific expansion of data processing is carried out within the framework of HOTSPLOTS Passenger Flows & Passenger Volume, including the recording of data from end devices in the hotspot environment and other information available in the vehicle. These can be data on the current trip (e.g. information on line, stop or direction of travel) and from the vehicle itself (e.g. door signals).
HOTSPLOTS processes the available information and displays these graphically or provides the aggregated data for integration into customer systems via API.
The solution is divided into the two sections "Passenger Volume" and "Passenger Flows", which can be used for different application scenarios.
 HOTSPLOTS Passenger Volume
By means of the WiFi usage data of vehicle routers, it is possible to determine the utilisation in vehicles. Combined with information on the current trip, these data can be made available in real time and can also be used in the HOTSPLOTS evaluation platform for historical analyses.
Features at a glance:
- Evaluation of end devices at vehicle level (hotspot)
- Correlation with line/trip possible
- In the cloud: Extensive functions for evaluating passenger data in the HOTSPLOTS customer area.
- From the cloud: Download of data for own further processing
- Live within your own system: API for retrieving data in real time for individual use, e.g. for heat maps, capacity utilisation displays, threshold analyses, traffic planning, etc.
- No separate consent by WiFi users required
Possible use scenarios of the data:
- Display of the vehicle utilisation on a map view (website & app). This allows passengers to see in advance whether the next bus or train is crowded and, if necessary, take the ride at a later time or switch to another line. Read more in our case study City of Offenburg/newcon GmbH
- Data-based measurement of threshold values, e.g. the number of passengers in vehicles or on platforms (increasing safety)
- Verification of models and forecasts (comparison of expected passenger volume at a certain point in time vs. actual passenger volume)
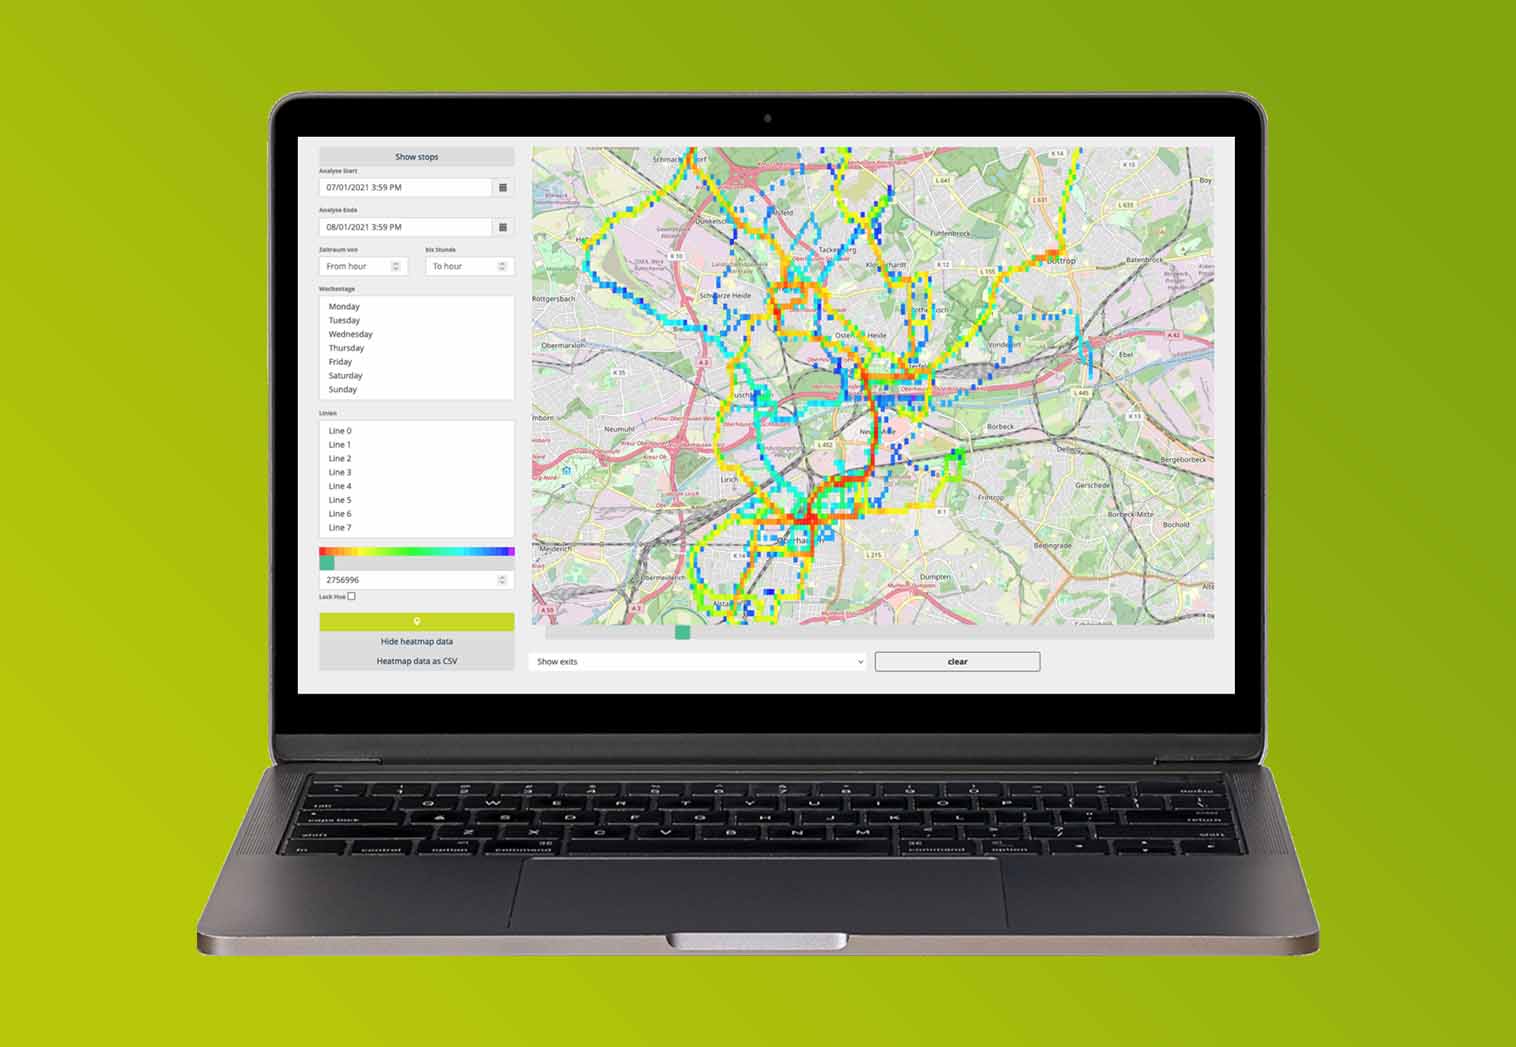
 HOTSPLOTS Passenger Flows
HOTSPLOTS offers a GDPR-compliant solution for recording, processing and visualising the movements of passenger flows. With the operation of a public WiFi hotspot, signals from end devices can be processed without additional hardware and installation effort, so that continuous quantitative statements about the transfer behaviour and travel routes of users are possible. A graphical presentation offers the intuitive analysis of passenger flows for the optimisation of public transport services in compliance with all data protection regulations. For systems that can be integrated, an API export is also possible.
Features at a glance:
- Monitoring of associated devices at transport network level (across hotspots)
- Various data can be added (e.g. IBIS vehicle bus, ITCS)
- Use for passenger flow analysis, route planning/optimisation and many more applications
Possible use scenarios of the data:
- Extensive data on place of departure, transfer stops and destination stops used by passengers in the transport network
- Data-based planning and optimisation for new and existing lines through analysis of passenger flows
- Insights from the analysis of passenger flows can be used to optimise timetables and vehicle dispatching
- Verification of models and forecasts (comparison of expected passenger volume at a certain point in time vs. actual passenger volume)
Have we sparked your interest?
Then call us on +49 30 29 77 348-83 or email fahrgastwlan(at)hotsplots.de to receive tailored assistance for your fleet.
More information is available here:
- HOTSPLOTS Passenger WiFi
- HOTSPLOTS Telemetry
- Brochure about HOTSPLOTS Telemetry
- Brochure for operators in public transport
- Brochure for operators
- Brochures about Bosch Coach MediaRouter
- Brochure on the Try&Buy offer on Bosch Coach MediaRouter
- Short manual start a public hotspot on Bosch Coach MediaRouter. incl. description of Try&Buy